


lundberg
-
Posts
158 -
Joined
-
Last visited
-
Days Won
3
Content Type
Forums
Profiles
BallOfSpray Posts
Events
Downloads
Store
Gallery
Quizzes
Posts posted by lundberg
-
-
@VONMAN I'm with you on the Denali journey; my skiing keeps getting better and I'm having so much fun! The C75 took me from 15off into 28off. I've been really tempted to try the C85 but now it looks like I might need to skip a model.

-
What is "Slalom Challenge Rd"?
Sunday, 10. of March 2024
10:00 AM OW Tricks Preliminary Rd- Top 6 Advance to Finals start list 11:30 AM OM Tricks Preliminary Rd- Top 8 Advance to Finals start list 2:40 PM OW Jump Preliminary Rd- Top 6 Advance to Finals start list 4:24 PM OW Slalom Challenge Rd- 8 Skiers- 4 passes each 5:47 PM OM Slalom Challenge Rd- 10 Skiers - 4 passes each -
On 1/8/2024 at 10:54 AM, Horton said:
@lundberg I may not get time to set it up today but your stuff could go in the downloads section. That way files could be as big as you want - within reason. I will set it up when I get a chance.
@Horton I was able to use the "downloads" approach to increase the resolution of an image, thanks!
-
Thanks again to @pkulio! His data is great and is making me think about what sort of trends I can find. Here is a look at a comparison of angle, speed and location in the course at centerline (gate, 1 to 2, 2 to 3.....). If you pair this data with video you might be able to correlate small details with the impact on angle and speed, what the actual difference between an "easy" pass and a "hard" pass.
Here is one of my 15off 34.2mph passes (at a minimum you can see that Paul runs and earlier line).
-
 1
1
-
-
@Horton is there a way to improve the resolution of the images in a post? Looks great on my PC but once it get's up loaded to the tread you can't see any detail.
-
Big thank you to @pkulio for being the first to collect and send me data! He has a nice set up running standard phone video at the same time he was capturing gyro and gps data using a ski doc orbit mount. He was skiing 36mph running passes at 28 and 32 off. The "handle path" at the bouy gets less accurate as the rope gets shorter as it begins to arc as the skier gets higher and more free of the boat. It should still be accurate when the rope is tight behind the boat showing location in the course as well as cross course angle, directional speed and peak swing speed.

-
2
-
-
The Denali set screw for the fin block was on the 3.x skis (I had a 3.4). It went away once they had the "CG fin" which had a similar impact with the cross drilled holes.
I liked the C65 and love the C75!
-
1
-
-
I was using a Rstyle and stopped because of foot pain. I went to a HRT and love it. Three other friends who were double boot users have also switched to HRTs and are happy.
-
On 8/17/2023 at 1:07 AM, thager said:
I didn't start to really improve until I stopped skiing -15 and -22 passes. Shorten the line to - 28 and use whatever speed necessary to run it. Slowly increase the speed as you get success.
@thager I took your advice this weekend. I've been a 15 off skier in the course a long time, just last year running my first 34.2 pass one time. This year, after loosing a little more weight and trying to understand the dynamics that need to happen between hook up and edge change, I've been improving each time I get a chance to ski in the course. I started taking shots at 22off with some success running it at 32.3 and 5.5 at 34.2 a month ago. This weekend I got 6 sets at StellaBlue and gave myself permission to go have fun and try 28off, even right from the dock. It was so fun and different. I could feel the dynamics better and realize the things I was "getting away with" at longer lines. The punchline is that I ran multiple 28offs at 32.3 and rounded 4 ball at 34.2! I'm pumped and bummed the season is coming to an end for me here in Washington.
-
7
-
-
On 7/21/2023 at 5:27 PM, adamhcaldwell said:
@Lundberg....I think you lost them at Matlab.....
@AdamCords college buddy Tom Pollock did this with us via dual strain gage on pylon at Trophy.
See if you can head to Hilltop with Cord this weekend and get some data through 41 with your setup. I'd say come here, but thats a long as flight.
@adamhcaldwell thanks for the encouragement! I reached out to Cord and could not make this weekend happen, but I'll try again.
-
@Kroeks has it right, the plots show the course starting at the bottom and running to the top. As you round the ball you slow down as the swing goes away from the boat and you are just starting to accelerate. The pink mark shows where the peak swing speed happens and the green where max speed over the water happens. In the last plot you can see that my peak swing speed is just before centerline and the peak speed happens sometime later as your direction becomes more in line with the boat. You can see how I'm getting later and later by how close the max speed is to the ball. You can also see how I pulled long to 6 and my peak swing speed was after centerline.
-
1
-
-
I just finished listening to the latest spray makers podcast on gates, and loved the talk about "handle path". I wonder if you'd be up for collecting some data to see how it aligns with your thinking?
-
This is an update for my effort to understand what is going on while I ski.
It started in the winter with a parameterized matlab model of the handle path based on a swing profile.
part 1-
https://ballofspray.com/forums/topic/51107-slalom-ski-path-physics-matlab-model/#comment-846939
followed by a simple setup to measure the actual swing profile with rope tracking camera mount and phone app to record the gyroscope data
part 2-
https://ballofspray.com/forums/topic/51660-slalom-ski-handle-path-physics-part-2/#comment-850767
A couple of weeks ago I took a trip to StellaBlue and had a chance to collect some data in the course and have a great time skiing! (Side note - I improve my PB almost a full pass, running 15off/34.2 (7 times), getting around 4 ball at 22off/34.2mph and around 3 ball @ 28off/32.3mph)
Here are a couple of fun pictures from the trip (you should go to StellaBlue if get a chance)
So here is the data. There is lots of info here, but I think it would be most useful for those who are trying to make a change and see / measure the impact. Whether it is location in the course for gates, speed dynamics (think "fast vs slow" ski), differences between onside and offside, or "what is another skier actually doing differently than I am"....its all here. If you collect some as I described in part 2 I'd be happy to "process" it for you.
(The plots are not to scale (x vs y). I'll put one at the end for reference.)
-
6
-
-
I captured another data set this morning. Lot's of info can be mined from this data.
zoomed in and to scale
-
That looks interesting, I wonder if the major amount of "drift" you had was related to the camera mount not being firmly connected to the rope. This feature (hysteresis) makes for smoother filming but corrupts the data that I'm looking for by letting the rope change angle without the phone moving at the same time.
I took the raw gyro data (radians / sec sampled at 50Hz) and heavily filtered it before I did any integration to get angle data. I'll collect more data to see how repeatable it is but the two data sets we got this week looked promising.
With only a phone and a simple pylon mount I can "measure" what is happening at the handle (location and velocity (speed and direction)).
I need more data to make dial it in. Who's going to help me?
-
Back in February I shared a Matlab model that I made to better understand what was going on at the end of the rope.
Out of that conversation I had an idea of a simple way to collect real skiing data to compare to the model. Well the boat is running and the water was nice so I gave it a shot.
(Right up front, if this looks interesting to you message me. If you capture data, I'll process it for you and make some plots!)
Setup:
1) Pylon camera mount (snug up where it tracks the rope so that it does not have any slop).
2) Phone with an app to capture the Gyroscope and GPS (https://www.tszheichoi.com/sensorlogger)
3) Go ski and capture data, note boat speed and rope length.
My buddy @Rodwishart1 and I went free skiing at 32off / 34.2mph
After some filtering and a little math here is what I got.
You loose a little accuracy at width when the rope goes slack so it will underestimate that part but it tracks real nice once it is moving, allowing you to capture where your dynamics peak; min speed (agrees with the model showing speeds in the mid 25mph after the turn), peak swing speed (late for my simulated gate and before mid-line once in rhythm), and max speed (upper ~48mph for me).
It is clear from this data that I free ski narrow and with two slow of a rhythm.
Here is a plot (not to scale) showing where the different dynamics are happening).
Here is the same plot zoomed in but to scale showing the rope angle to the boat and a modeled handle path.
This is real data. It would be interesting to use this to see (measure) what skiers do different or when you make a change to correlate what you feel with what was happening.

-
2
-
-
@Bruce_Butterfield @MarcusBrown @dchristman
I think the interesting question is not "is one path longer or is the average speed higher", but instead what are the dynamics of the skier's speed from buoy to buoy as the rope length changes.
The average speed / path length in my model is very close between 15 off and 41 off (0.4 mph and 0.5m)
To make the path lengths the same at 15 off and 41 off in my model I can just tweak the reach length which changes the rope angle from 37.2 to 38.9 degrees (vs 78 degrees for 41 off with a much greater reach)
-
1
-
 1
1
-
-
@MarcusBrownthat is an awesome clip!
Here is what my model looks like for 18.25m vs 10.25m (remember this is handle path not ski path so the rope does not get to full width)
58 kph / 36 mph with peak swing speed at center-line
Average speed from buoy to buoy is
18.25m (15' off) = 67.7 kph (42.1 mph) / distance travelled = 47.9m
vs
10.25m (41' off) = 68.4kph (42.5 mph) / distance travelled = 48.4m
(shortest possible path with no reach would be 47m)
-
5
-
-
I agree with Adam, there a ton of caveats / nuances when comparing different line lengths. You have a lot more options when the rope is long. That said, I'm convinced that if you assume a tight line all you need to know about the handle path is the angle of the rope in relationship to the boat path over time. The plots that I made in the thread "Slalom Ski Path Physics (Matlab Model)" show the handle path and other dynamics for different rope lengths assuming you only go as wide and you need to go around the buoy and have a particular swing velocity profile over the arc that is traveled (angle of rope over time). With those things constant you can see from the plots that a short rope has a longer path and thus a faster average speed over the water (different the than the average speed down the lake). If the swing profile is different it changes your path. You could show that a different swing profile with a wider apex and/or higher cross course peak speed could make a long line path longer than a shortline path.
This year I'm going to see if I can make my camera mount track tight with the rope (bad for video but good for collecting angle data). With a little offline filtering I bet I can make handle path plots plus all the speed and acceleration data too. (assuming constant boat speed)
I just changed jobs and don't have access to Matlab right now (hopefully soon) but it should be straight forward to show average directional speed and distance from the model data that I have already. Stand by....
@MarcusBrown pointed out to me that the title of my previous tread was wrong and should have been "Slalom Handle Path Physics" (not Ski Path) and I agree. I've been thinking about how to parametrize the ski location in relationship to the handle.
Here is what I'm thinking:
Define the ski location as the point between your front and back foot.
From the top view (drone perspective)
1) at the apex of the swing the ski is at the reach length away from the handle and inline with the handle to the pylon.
2) as the turn starts the handle stops moving up on the boat and starts falling back down the arc, but the ski keeps gaining and rotates around the handle. At the end of the turn it is closer to the boat than the handle and in line with rope (or maybe a little behind)
3) at some point in the swing as you start to stand up the handle and the ski will be at the same spot.
4) as you approach apex the ski starts to move away from the handle until the turn starts
So I think all I need are locations in the swing where
1) the ski is starting to take load (after turn, maybe where down course speed starts increasing) and how far in front of the handle it is
2) ski is under the handle
I should be able to interpolate between the full reach and point 1, point 1 and point 2, and point 2 to apex.
I'm open to input!
-
1
-
-
Here you go. Interestingly the handle path is the same for all speeds (assuming the same swing profile, max swing speed is just before the wakes). The big difference is you have to go a lot faster since the time is getting shorter between the buoys.
It would be really interesting to get swing profile data from real skiing to see how it matches. In a couple months when my boat is out of storage I've got some ideas I want to try.


-
1
-
-
2 hours ago, GSchmid said:
1) peak velocity occurs much later vs. centerline than I would have guessed.
yep, it is because the speed you made "swinging" goes from cross course to down course and they add together. This is how you catch up to the boat.
2 hours ago, GSchmid said:2) skiing an "earlier line" looks like a disadvantage in terms of both load profile on the boat and the change in velocity experienced at the buoy. (is that a correct interpretation)
I think so but I also think you end up with less time / width approaching the ball. I'm guessing if you can handle the load, more margin for error might be more valuable.
As for the speed control, I haven't thought about it nor do I have enough experience to comment.
Right now I'm wrestling with how to model the ski location with respect to the handle. I think there is some magic with how your ski carries speed while the handle swing comes to a stop and goes back the other direction.
-
It is hard to argue with the handle path if the goal is no slack. That being said, the "dynamics" of the swing can radically change the effective path, but what the ski does in relationship to the handle especially around the apex and finish of the turn is not modeled. It seems like there is a balance between creating more time / margin and minimizing acceleration. "Big" changes in speed is where things go wrong.
-
2
-
-
@aupatkingyes and it should equal the boat speed. With the assumption that the rope stays tight, the handle swing will go up on the boat, slow as it approaches max width / height and when it changes direction back towards the wakes it should match boat speed. As I type this I'm wondering if the difference in ski speed and handle speed is the highest at this point since it is moving from outside the handle line quickly to in line with the handle. (Looks like I'll need to update the model 😉)
-
2
-
-
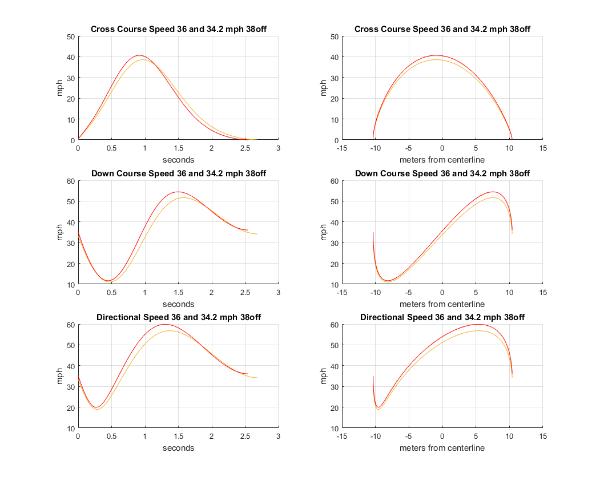
@S1Pitts Handle paths are the same (driven by the swing speed profile.
Here is the difference in speed at 38off for 34.2 and 36.
-
1
-
1
-


handle guard
in Skis Fins Bindings
Posted
I make my own as well.
Purchased sheet ABS from Amazon
https://www.amazon.com/gp/product/B08R9W4NZW/ref=ppx_yo_dt_b_search_asin_title?ie=UTF8&psc=1
You can cut it by scoring with a razor blade and bending it. Drill holes to attach and file the edges so they are not sharp. I like to attach with paracord and thread it through the rope to keep it from moving around. I also make two panels so that you can fold it to feed the handle through a loop.